Claiming one of these questions and making a post in the Practice Exam Forum explaining your work and an answer will earn you 5 bonus points on Exam 1 (both parts together are worth 200 points) if you make your post by some due date
Click Edit and add your name to the left-hand column of the problem you are choosing to complete. (A couple of these questions are dated now. Sorry about that.)
| Problem: Claimed by | The problem you will complete |
|---|---|
| 1.
|
|
| 2.
|
|
| 3. |
|
| 4.
|
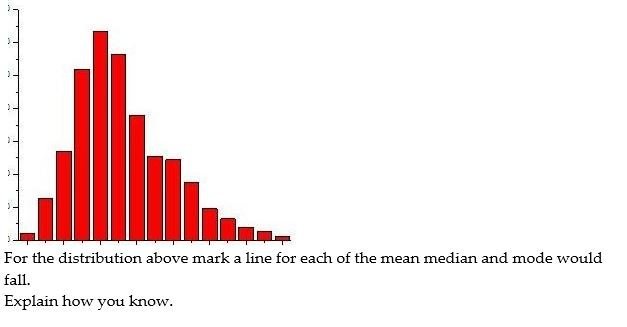
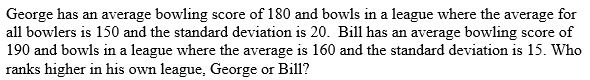
Joe Fadabucci of East Podunk, VT was sick and tired of cars speeding by his house. He need some data to support his case for the installation of a radar speed feedback sign to slow down traffic. He recorded the speed of cars driving past his house, where the speed limit is 20 mph. It is a random sample.
What shape does this distribution have? Which measure of center should we use to describe the “center”, the mean or the median? Why? (Think about the shape) What measure of spread should we use to describe this distribution? Why? (Think about the shape) Which outlier test should we use to check for outliers> Show us and determine if there are any outliers. Does this data support his case? Explain. |
|
5.
|
|
|
6.
|
|
| 7.
|
|
| 8.
|
|
| 9.
|
|
| 10.
|
Here is a data set. Excel <link> Google Sheets <link> You’ll either need to “Make a copy” for Google Sheets or download a copy and open it in Excel/Numbers/Open Office. Find the country that represents the 70th percentile Find the country that represents the 30th percentile. |
| 11.
|
|
| 12.
|
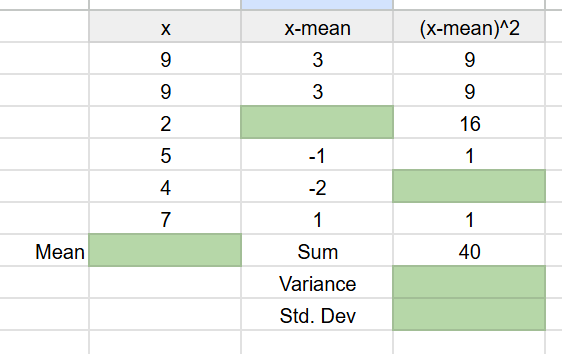
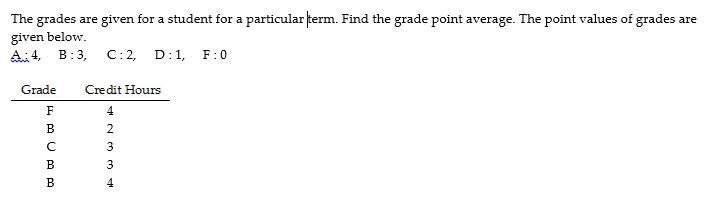
Complete the empty (green) spaces in this table for calculating the standard deviation for a small data set. Remember that the formula for a sample standard deviation is
Make sure to explain how you know. |
| 13.
|
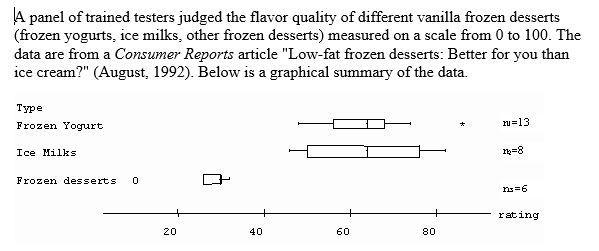
What conclusions can we draw? Connect your response to what we are seeing in these boxplots. |
| 14.
|
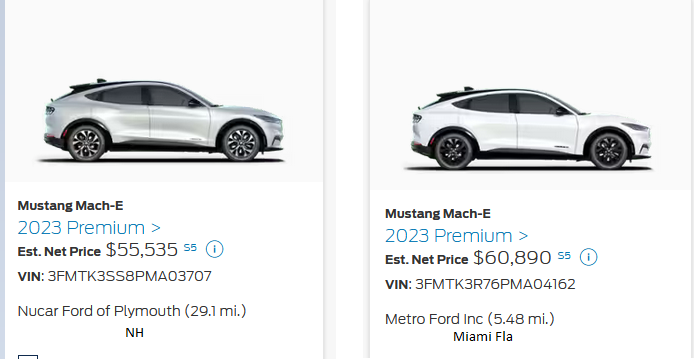
I had a 1968 Ford Mustang as a HS student. I’d like another one. Pricing out a dealership in Plymouth NH and one in Miami FLA, I find
Complete the following statements (show the calculations also) A Mustang in NH cost _________% A Mustang in Miami cost _________%
|
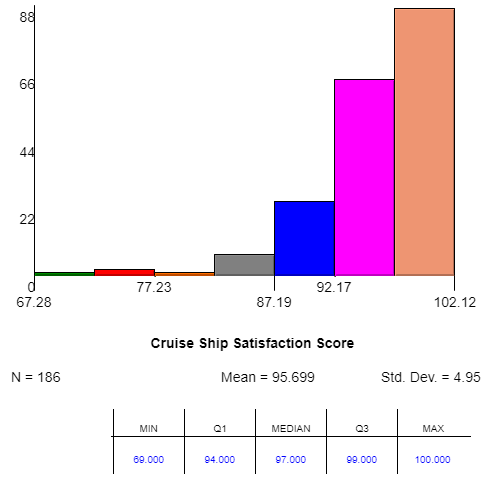
| 15. | Here is a histogram and summary statistics of the distribution of a sample of Cruise Ships Customer Satisfaction Scores
What shape does this distribution have? Which measure of center should we use to describe the “center”, the mean or the median? Why? (Think about the shape) What measure of spread should we use to describe this distribution? Why? (Think about the shape) Which outlier test should we use to check for outliers> Show us and determine if there are any outliers.
|
| 16.
|
Comment on the correctness of this graph by writing a couple of sentences.:
|
| 17.
|
Calculate the five number summary and the mean for the data in #4.
Suppose we change the 480 to 350. Which will change more: The median or the mean? why? |
| 18.
|
|
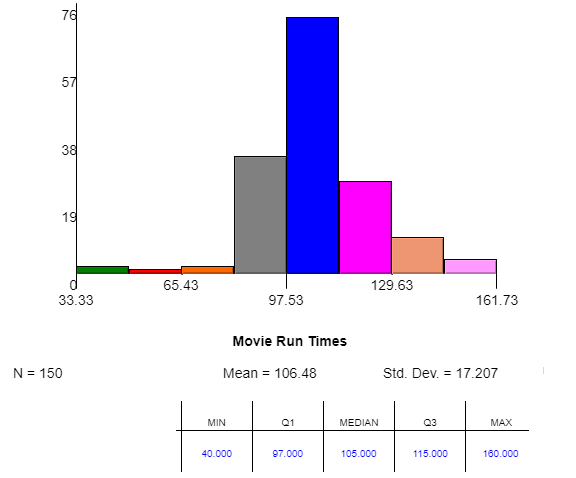
| 19. | Here is a histogram and summary statistics of the distribution of a sample of movie run times
What shape does this distribution have? Which measure of center should we use to describe the “center”, the mean or the median? Why? (Think about the shape) What measure of spread should we use to describe this distribution? Why? (Think about the shape) Which outlier test should we use to check for outliers> Show us and determine if there are any outliers.
|
| 20. | In the Super Bowl, by how many points does the winning team outscore the losers? Here are the winning margins (From Superbowl History from ESPN
Here is a spreadsheet of the winning margins for Super Bowl games including 2023. <A spreadsheet of the Superbowl data from ESPN> I’m assuming/hoping that you are using technology to do this.
c). What shape does this distribution have?
|